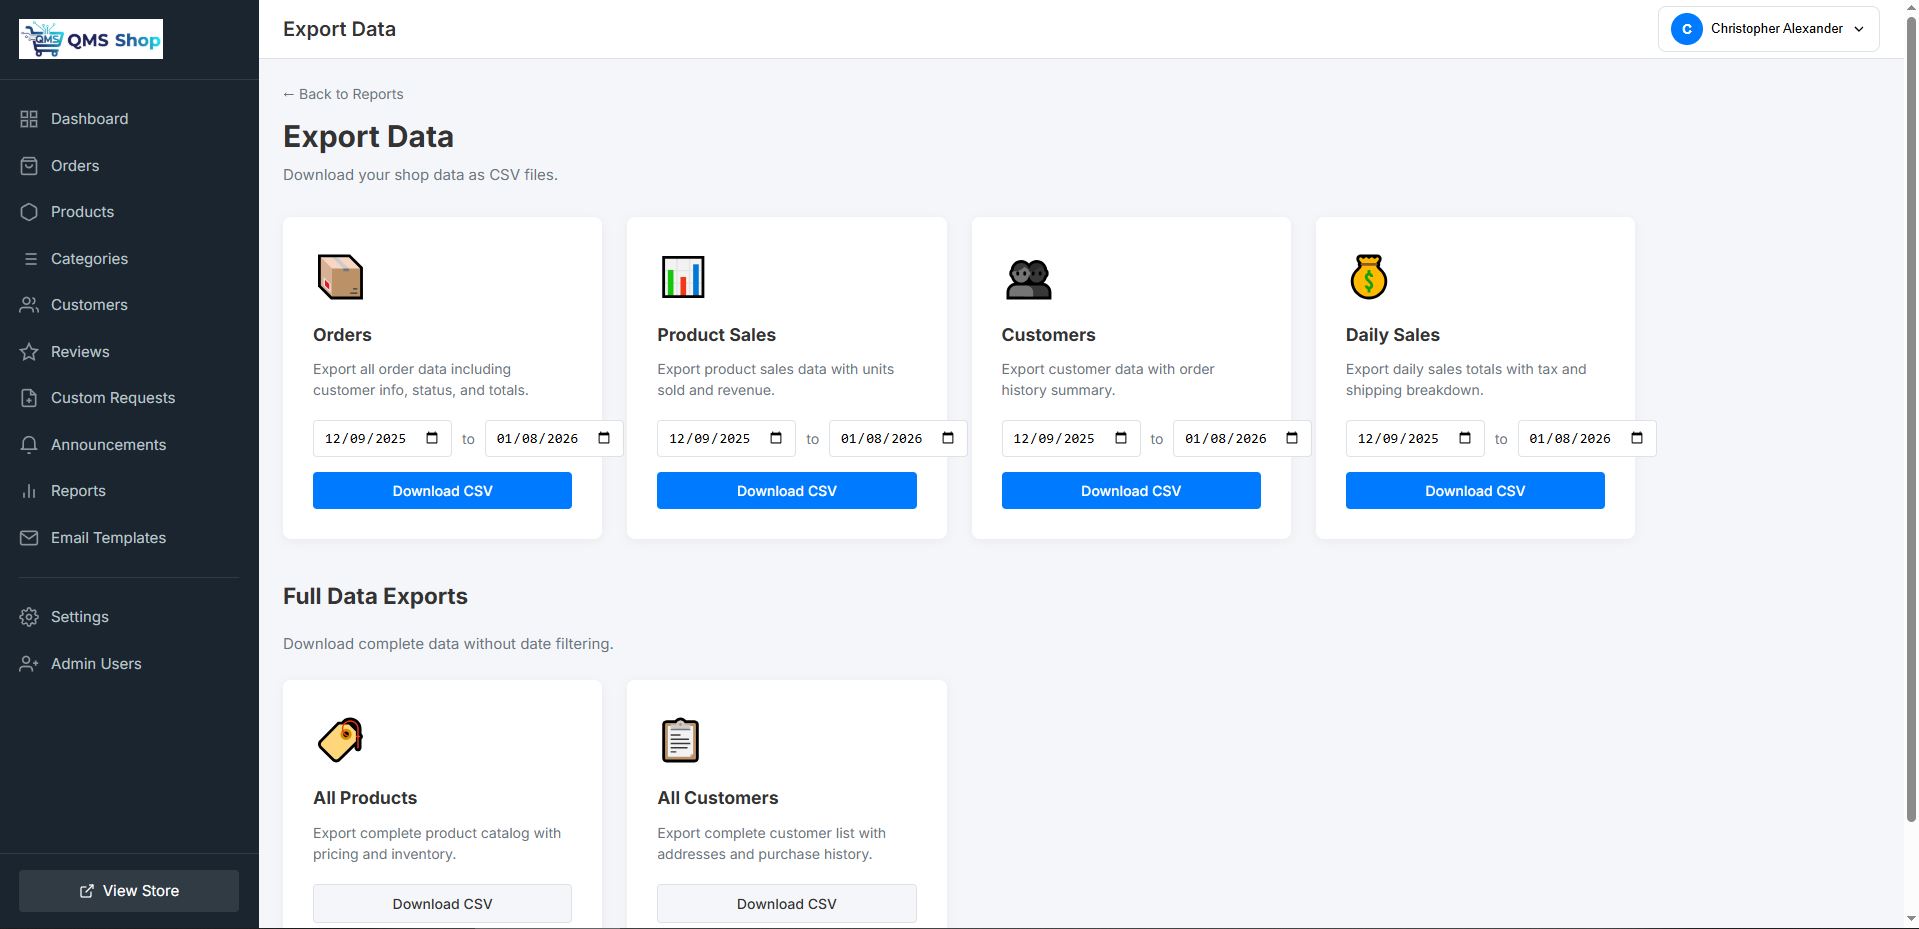
Reports & Analytics

Make data-driven decisions with comprehensive reporting. Understand your sales, products, and customers.

Reports Dashboard

Your command center for store performance. Key metrics at a glance with detailed drill-down capabilities.

$12,450 Revenue ↑ 15%
156 Orders ↑ 8%
$79.81 Avg Order ↑ 6%
89 Customers ↑ 12%

Comprehensive Reports

Every report you need to understand and grow your business.

📈

Sales Report

Track revenue over time with daily, weekly, or monthly breakdowns. See subtotals, tax, shipping, and net revenue.

📦

Product Report

See your best sellers, units sold, and revenue by product. Identify top performers and slow movers.

👥

Customer Report

Understand your customer base. New vs returning, top spenders, acquisition trends, and email opt-in rates.

🛒

Order Report

Order volume and status breakdown. Track fulfillment efficiency and order completion rates.

⚠️

Inventory Alerts

Low stock warnings and out-of-stock products. Never miss a sale due to inventory issues.

💳

Payment Report

Payment method breakdown, refund tracking, and transaction summaries for accounting.

📊

Sales Analytics

Deep dive into your revenue with flexible date ranges and grouping options.

  • Custom date range selection
  • Group by day, week, or month
  • Revenue trend charts
  • Comparison to previous period
  • Subtotal, tax, and shipping breakdown
  • Discount tracking
🏆

Product Performance

Know exactly which products are driving your business.

  • Top selling products by revenue
  • Top selling products by units
  • Sales by category
  • Products never sold
  • Low stock alerts
  • Product trend analysis
👤

Customer Insights

Understand who your customers are and how they shop.

  • New customer acquisition
  • Returning customer rate
  • Customer lifetime value
  • Top customers by spend
  • Email subscription rates
  • Customer growth trends

Export Your Data

Your data belongs to you. Export any report to CSV for further analysis, accounting, or backup.

  • Orders export with full details
  • Product sales export
  • Customer list export
  • Daily sales summary
  • Complete product catalog
  • Custom date range filtering
Book a Demo
Data Export

Visual Analytics

Interactive charts and graphs make it easy to spot trends and patterns.

📈

Revenue Charts

Line and bar charts showing revenue over time with period comparisons.

🥧

Category Breakdown

See revenue distribution across product categories.

📊

Order Status

Visual breakdown of orders by status for quick fulfillment insights.

👥

Customer Trends

Track new customer acquisition and growth over time.

Admin Dashboard Insights

Key metrics right on your admin dashboard for quick daily review.

💰 Today's Revenue

Real-time revenue for the current day.

🛒 Today's Orders

Number of orders placed today.

⏳ Pending Orders

Orders awaiting processing.

⚠️ Low Stock Items

Products needing restocking.

⭐ Pending Reviews

Customer reviews awaiting approval.

📋 Recent Orders

Quick view of latest orders.

Ready to Understand Your Business?

See how QMS-SHOP reporting can drive smarter decisions.

Book Your Free Demo